Start your free golden ratio measurement scan
Full resolution
478 landmarks
During free scans, your photo stays on your device and is not uploaded to our server. All analysis happens in your browser. We keep only anonymous numerical, non-identifiable measurements, never your photo. See our privacy promise.
Face height to width against 1.618
Golden ratio face calculator: test your face against 1.618
The golden ratio, about 1.618, is the classical proportion most often quoted for a balanced face. This free golden ratio face test measures your face height against your face width from 478 landmarks and shows how close the result sits to 1.618.
Free basic reports require no credit card, no account, no password. Your image is never uploaded or stored. Analysis happens in your browser and your session data is cleared when you close or refresh the page.
In short
A golden ratio face calculator divides face height by face width and compares the result with phi, about 1.618. Facemap measures height from the top of the forehead to the chin and width across the cheekbones, using 478 landmarks, then scores how close your ratio sits to 1.618.
- 3D landmarks
- 4783D landmarks
- Scan time
- ~20sScan time
- Uploads, runs in browser
- 0Uploads, runs in browser
- No account required
- FreeNo account required
Where it is measured
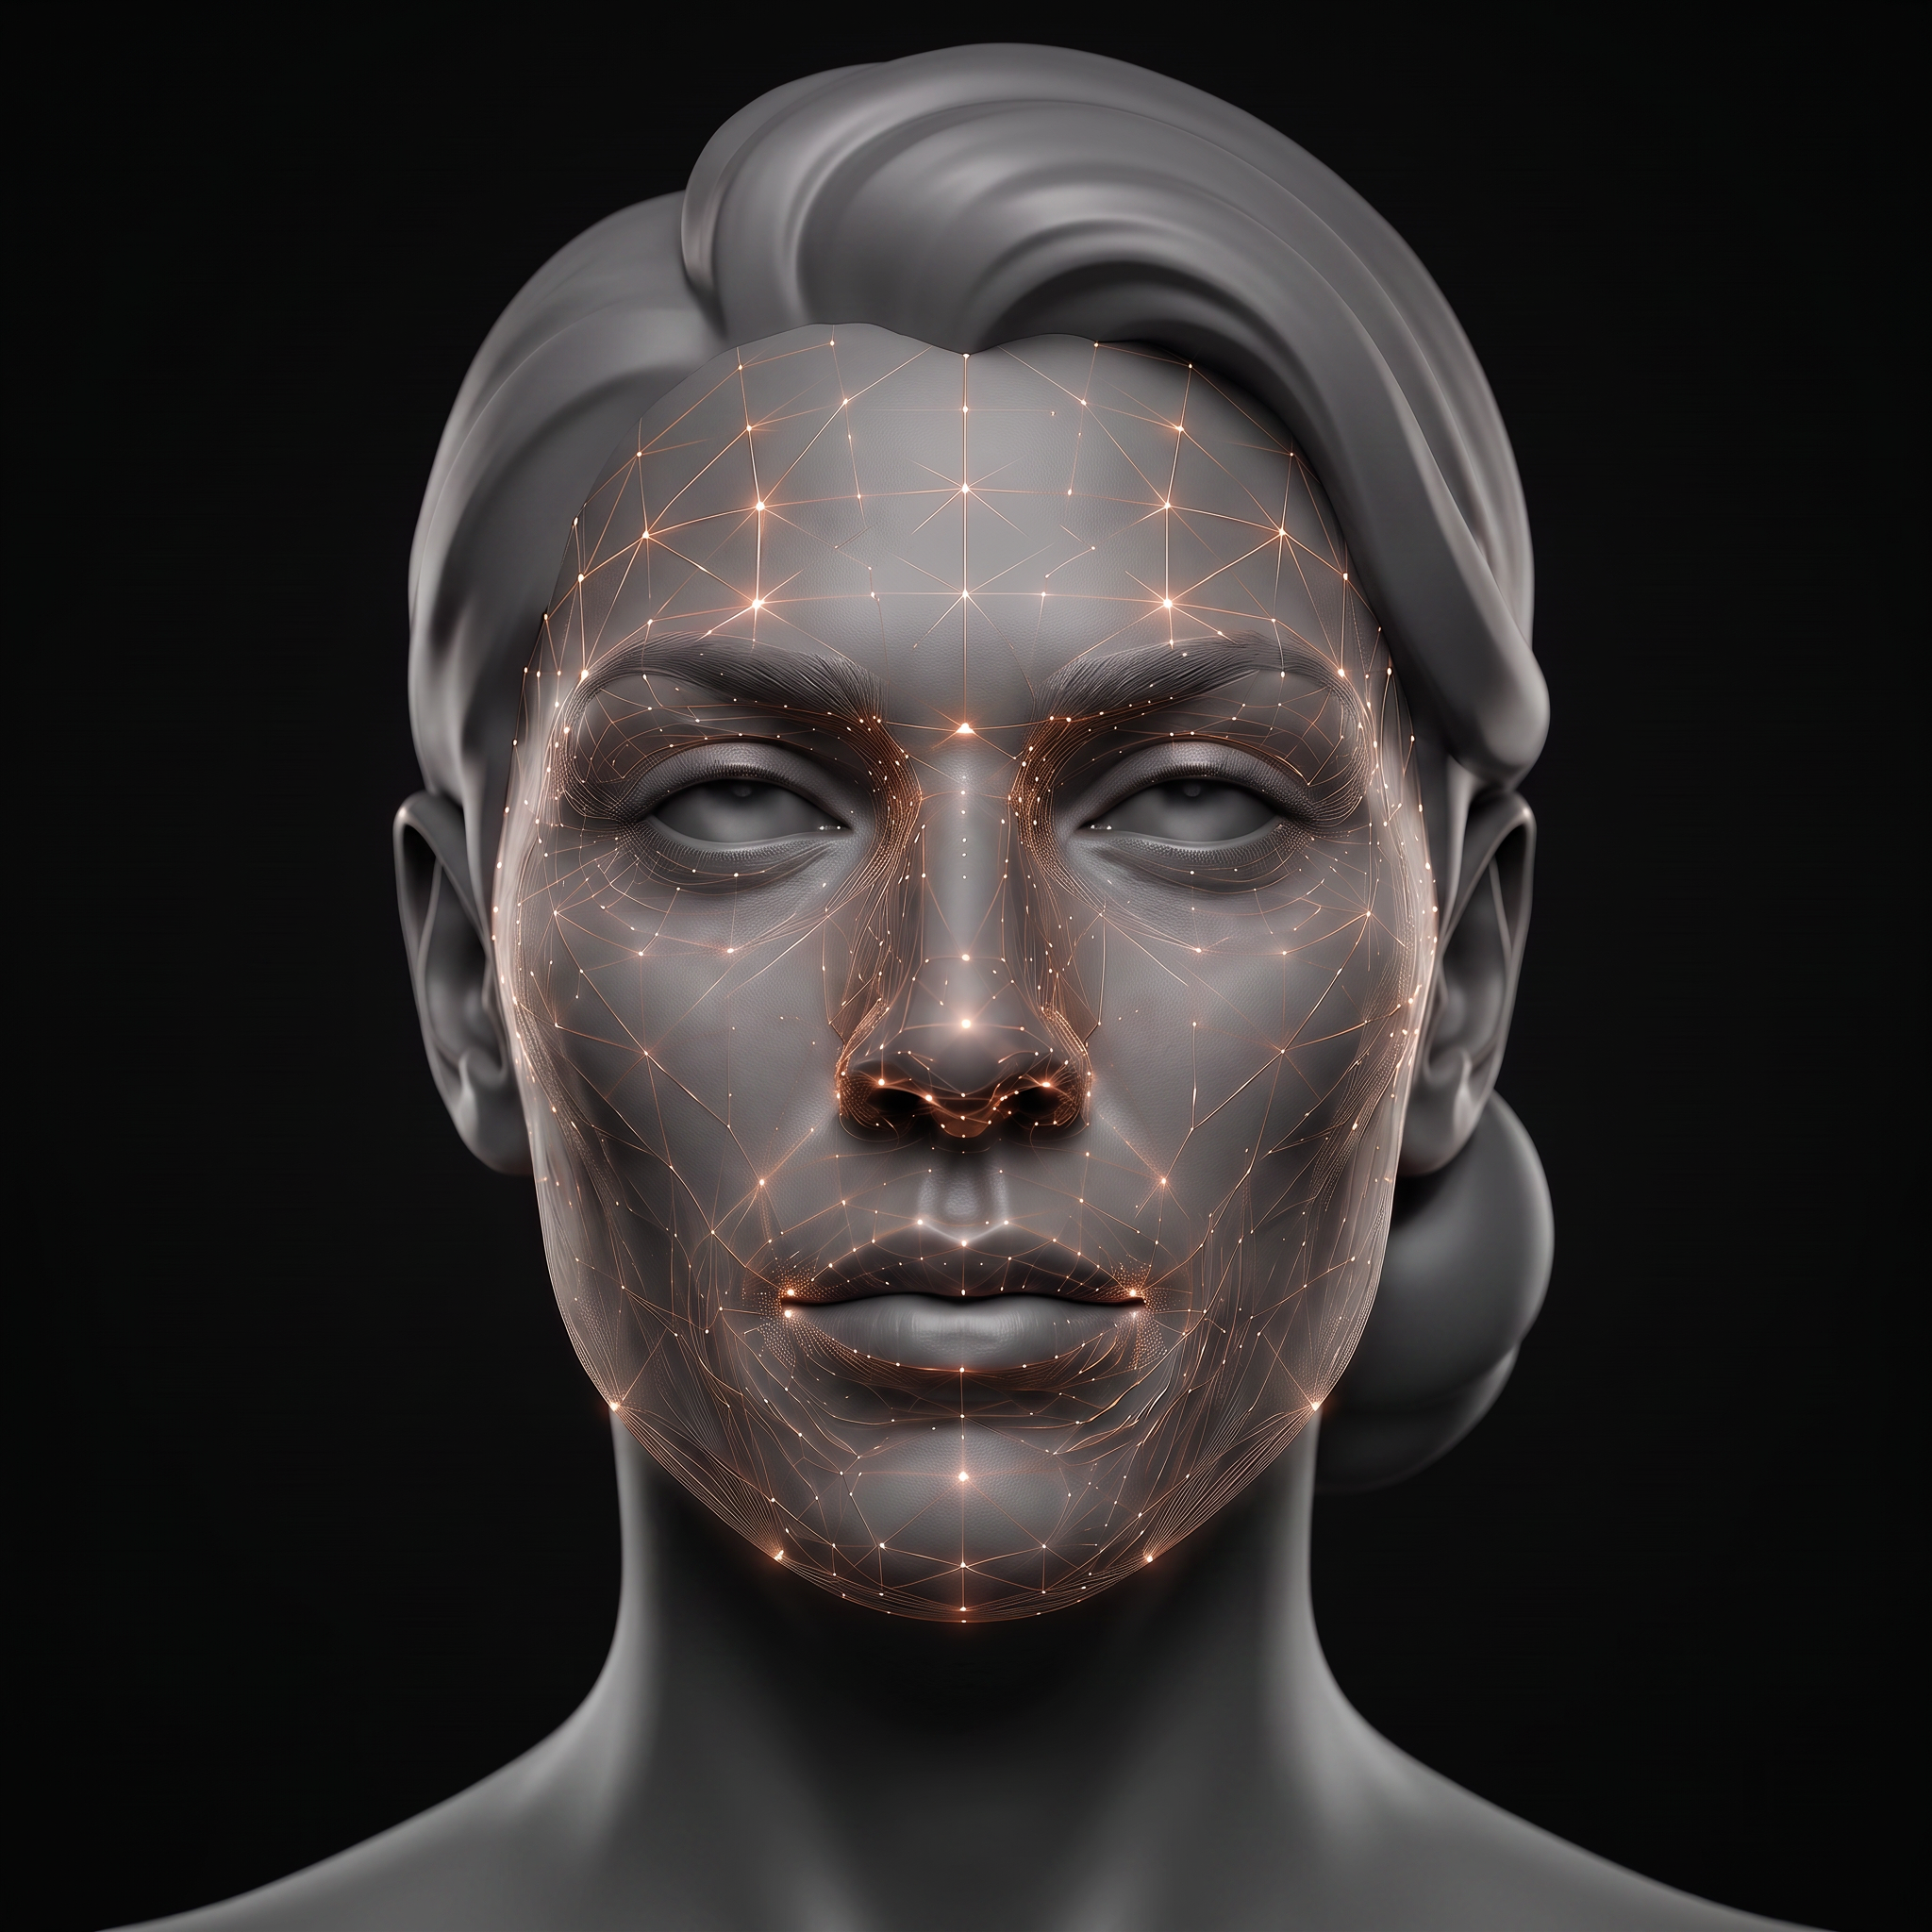
Golden ratio on the landmark mesh.
The overlay is drawn from the same 478 point MediaPipe landmark set Facemap uses on your own scan, so every caliper, axis and node sits on the exact anatomy the measurement is taken from.
Sample reading, Face height to width against 1.618

- Phi target
- 1.618
- Measured ratio
- 1.594
- Variance
- 1.5%
How the scan works
Capture
Guided front-on frame with even light, no upload.
Landmark
478 point mesh placed on your face in real time.
Report
Golden ratio measured, normalised and explained.
What is golden ratio?
Your face height, from the top of the forehead to the chin, divided by your face width across the cheekbones, compared with the classical 1.618 proportion.
How Facemap measures golden ratio
Both distances are taken from the 478-point landmark mesh, so the ratio does not depend on how far you sat from the camera. When the forehead is partly covered, the reading is given less weight rather than scored as if the hairline were visible.
What the typical range looks like
Real faces rarely land exactly on 1.618. A ratio close to it reads as a longer, balanced oval; a lower ratio reads wider and more compact. Neither is wrong, it is a description of your proportions.
How to read your result
Treat the golden ratio as a descriptive lens, not a law of beauty. It is useful because it makes the balance between length and width visible and comparable over time.
The golden ratio formula: how we calculate it
Face height against face width. Landmark numbers are MediaPipe Face Landmarker indices, and every distance is normalised to your own face so camera distance and image size cancel out.
dist(10, 152) / dist(234, 454)
- Landmarks used
- 10, 152, 234, 454
- Reference target
- 1.618
- Tolerance band
- 0.26
Your reading is compared with that published reference on a Gaussian match curve: score = round( 100 x exp( -0.5 x ( (reading - target) / tolerance )^2 ) ), clamped to 1 to 99. Basis for the reference value: the classical golden section, used as a reference point, not a law of beauty. The headline Attractiveness Score works differently: all readings are corrected for head angle and expression, weighted by confidence and mapped onto a 1 to 100 scale by a model calibrated against a published research set of more than Facemap scans.
Read the full Facemap methodology, including how the 22 measurement categories combine into your Attractiveness Score.
Golden ratio reference table
Face height to width and how each band reads.
- 1.55 to 1.68Close to phi
Length and width sit near the classical 1.618 proportion
- 1.40 to 1.55Slightly wide
A balanced face that reads a little broader than phi
- Below 1.40Wide
A compact, wide proportion
- Above 1.68Long
A longer proportion than phi
What the golden ratio face test measures
Facemap takes one clearly defined pairing, so the number is repeatable and easy to check.
- Face height: top of the forehead (landmark 10) to the chin (landmark 152)
- Face width: across the cheekbones (landmarks 234 and 454)
- Ratio: face height divided by face width
- Score: how close that ratio sits to 1.618
Does the golden ratio actually predict attractiveness?
The evidence is far weaker than the popular framing suggests. Phi is a convention inherited from classical art, and studies testing it against rated attractiveness produce mixed results. Facemap reports it because it is an interpretable, repeatable way to describe proportion, and it sits alongside 21 other measurements rather than standing in for all of them.
Golden ratio versus your other proportion scores
The golden ratio overlaps with facial thirds, facial width-to-height ratio and face shape. If your ratio sits away from 1.618, those readings show which part of the face is driving it, which is more useful than a single figure.
The golden ratio formula, step by step
The calculation is simple enough to check by hand.
- Measure face height from the top of the forehead to the chin
- Measure face width across the cheekbones
- Divide height by width
- Compare the result with phi, about 1.618
Your reading
Measure your golden ratio in about twenty seconds.
The scan runs in your browser. Nothing is uploaded, and free basic reports need no account.
Questions
Golden ratio face calculator: frequently asked questions
Is the golden ratio really linked to attractiveness?
It is a long-standing descriptive framework rather than a proven rule. Facemap reports it because it is an interpretable way to describe proportion, alongside 21 other measurements.
Do I need to upload a photo?
No. A free scan runs in your browser and the image is never uploaded.
What is a good golden ratio face score?
A face height to width ratio between about 1.55 and 1.68 sits close to phi. Most faces land a little below it, which simply reads as a slightly wider face.
How accurate is a golden ratio face calculator?
It is as accurate as its landmarks and your photo. Facemap uses 478 landmarks and averages three photographs, and a covered forehead lowers the weight given to the reading.
Can I compare my golden ratio results over time?
Yes. Because the ratio does not depend on camera distance, scans taken under similar conditions are directly comparable.
What is the golden ratio formula?
Face height divided by face width, compared with phi, about 1.618.
Is the golden ratio calculator an AI face scan?
Yes. It runs Google's MediaPipe face landmark model in your browser to place 478 landmarks, with no upload, so the ratio comes from measured geometry rather than an opinion.
Related tools
Measurements that read alongside golden ratio.
Vertical proportion balance
Facial thirds face scan
The face is divided into three equal vertical zones: hairline to brow, brow to nose base, and nose base to chin. We measure how evenly your landmarks fall within each.
Bizygomatic width to height
fWHR face scan
Facial width-to-height ratio compares the horizontal width of your cheekbones against the vertical height of your upper face.
Free detector, test and styling guide
Face shape face scan
We compare face length, cheekbone width, forehead width, jaw width and jaw angle to classify your outline into one of five measured face-shape families.
Every tool