Start your free fwhr measurement scan
Full resolution
478 landmarks
During free scans, your photo stays on your device and is not uploaded to our server. All analysis happens in your browser. We keep only anonymous numerical, non-identifiable measurements, never your photo. See our privacy promise.
Bizygomatic width to height
fWHR test: calculate your facial width-to-height ratio
Facial width-to-height ratio, fWHR, compares the width of your face at the cheekbones against the height of your upper face. This free fWHR calculator uses an AI face scan to take both distances from your own landmarks and reports the ratio directly.
Free basic reports require no credit card, no account, no password. Your image is never uploaded or stored. Analysis happens in your browser and your session data is cleared when you close or refresh the page.
In short
fWHR is calculated by dividing bizygomatic width, the distance between your cheekbones, by upper face height, the distance from your brow line to your upper lip. Facemap measures both from 478 3D landmarks and reports the ratio, typically between 1.6 and 2.1.
- 3D landmarks
- 4783D landmarks
- Scan time
- ~20sScan time
- Uploads, runs in browser
- 0Uploads, runs in browser
- No account required
- FreeNo account required
Where it is measured
fWHR on the landmark mesh.
The overlay is drawn from the same 478 point MediaPipe landmark set Facemap uses on your own scan, so every caliper, axis and node sits on the exact anatomy the measurement is taken from.
Sample reading, Bizygomatic width to height
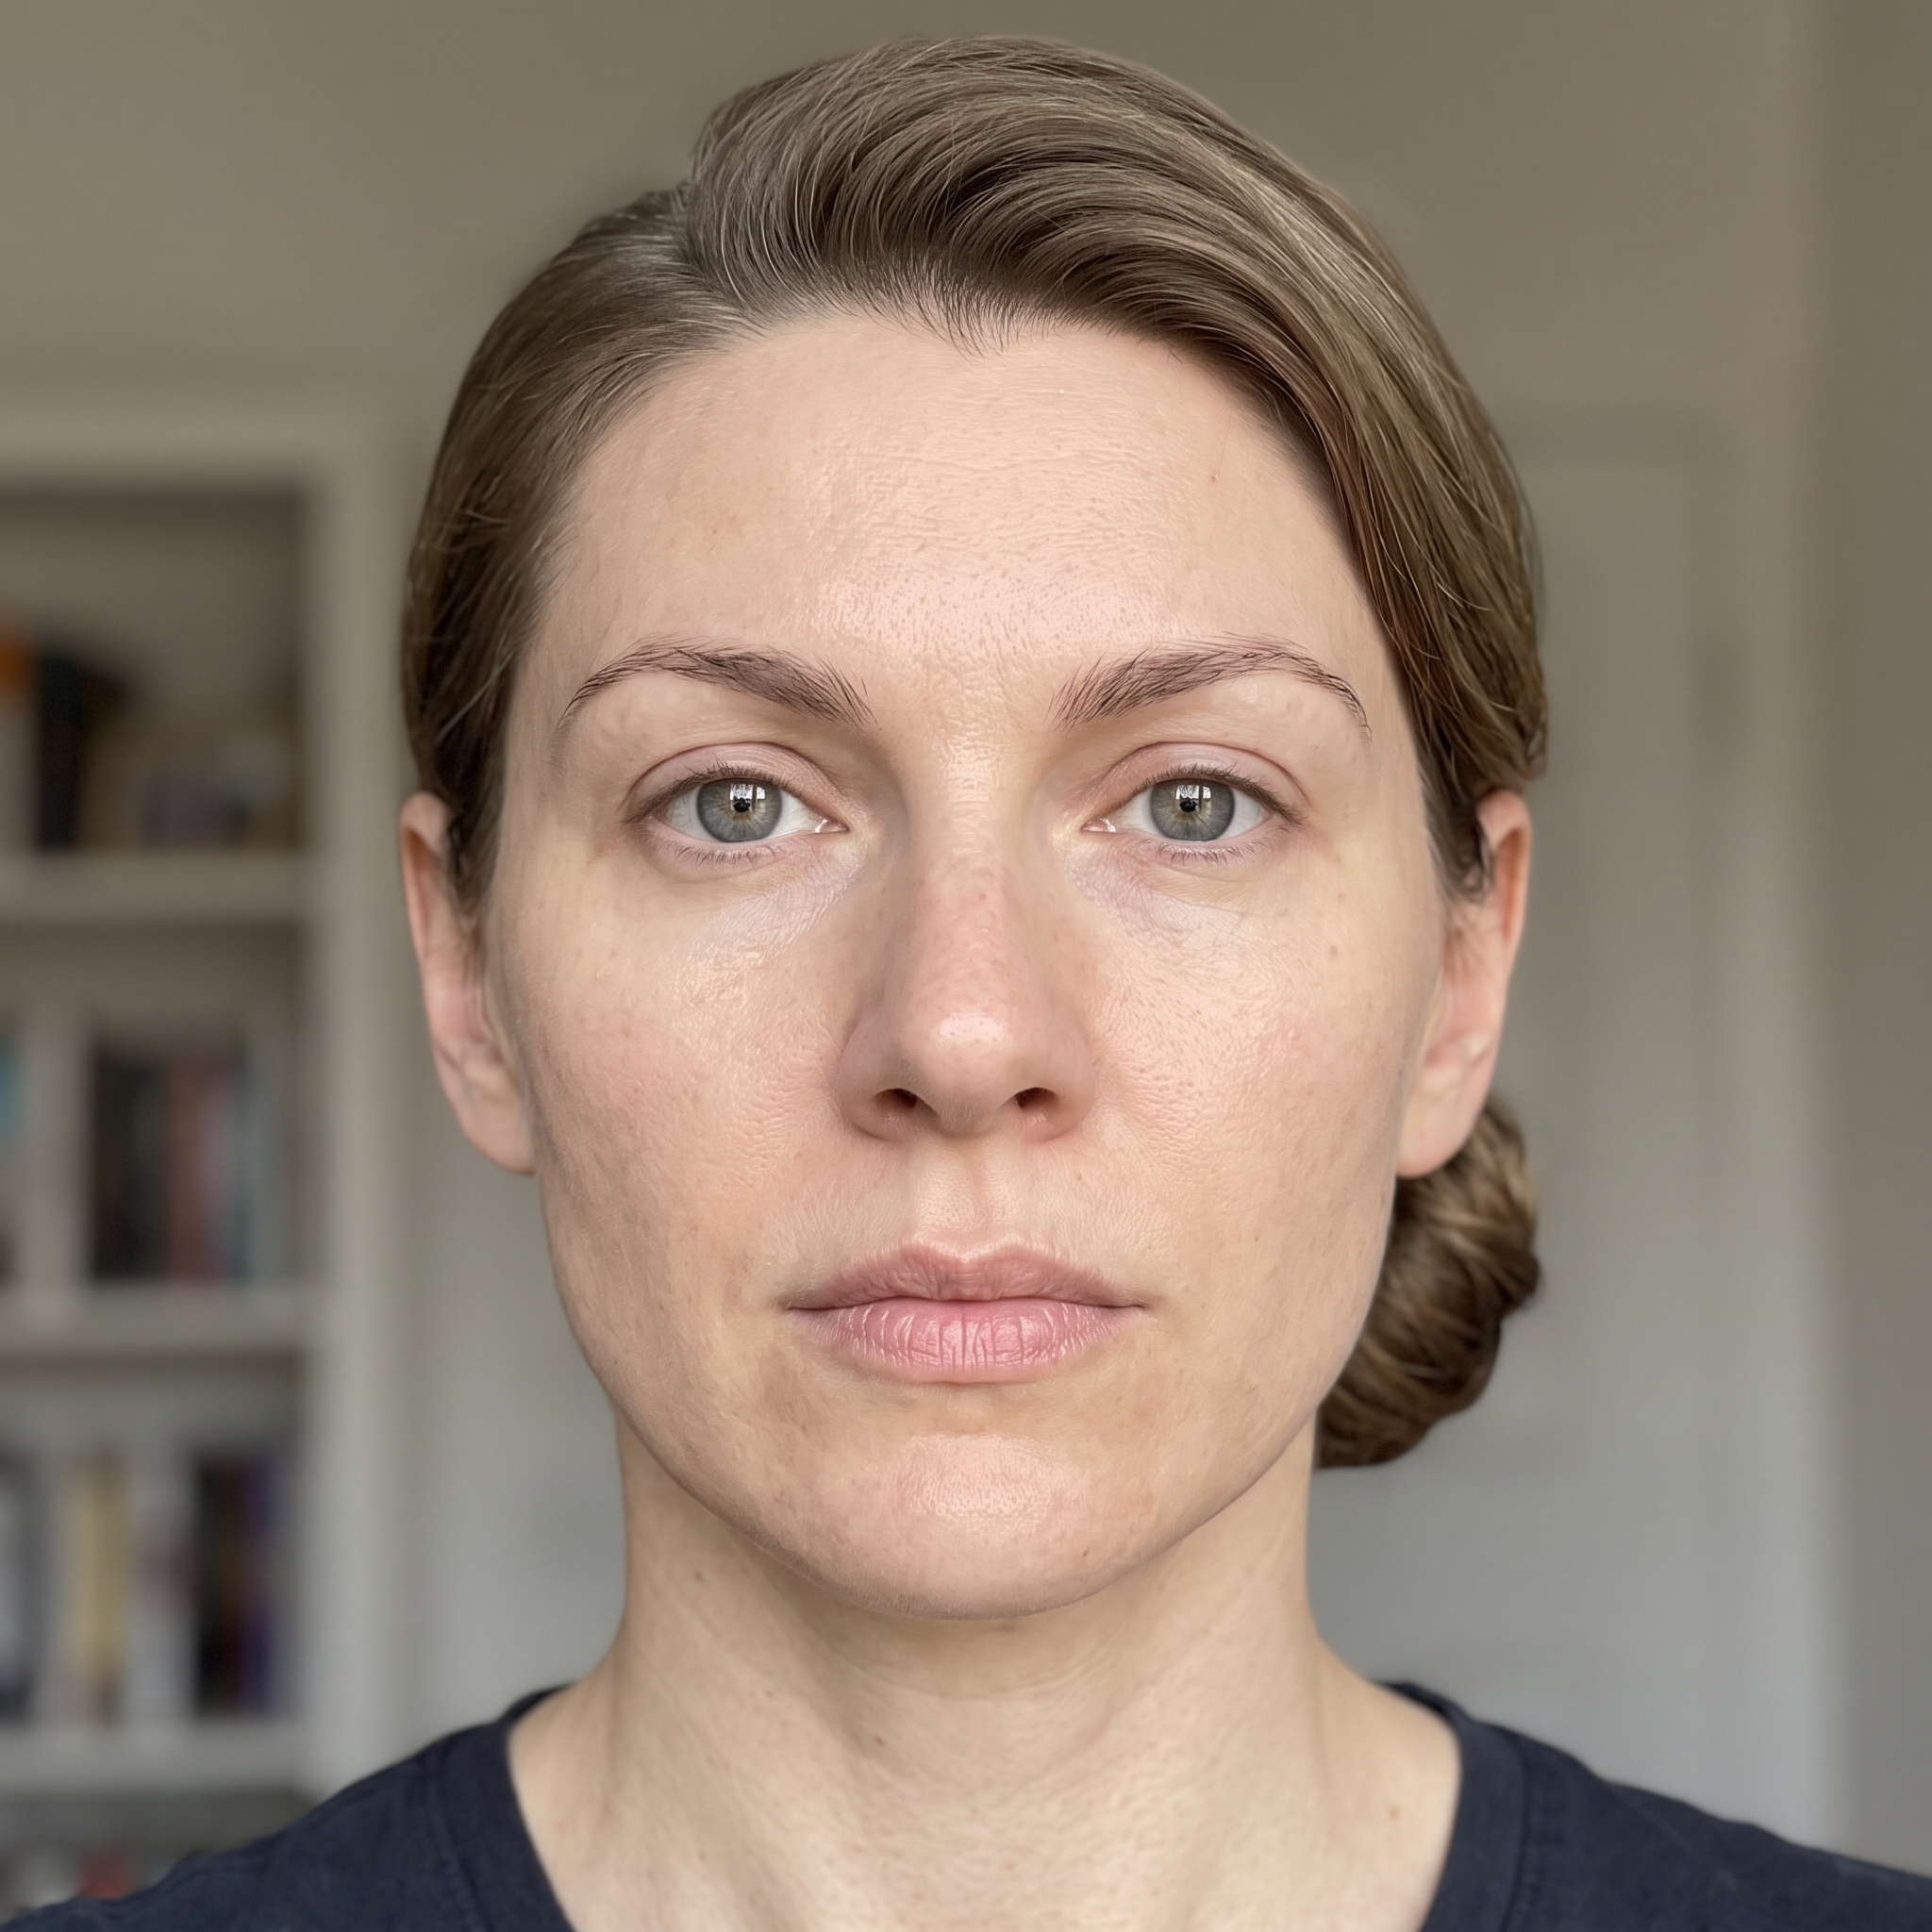
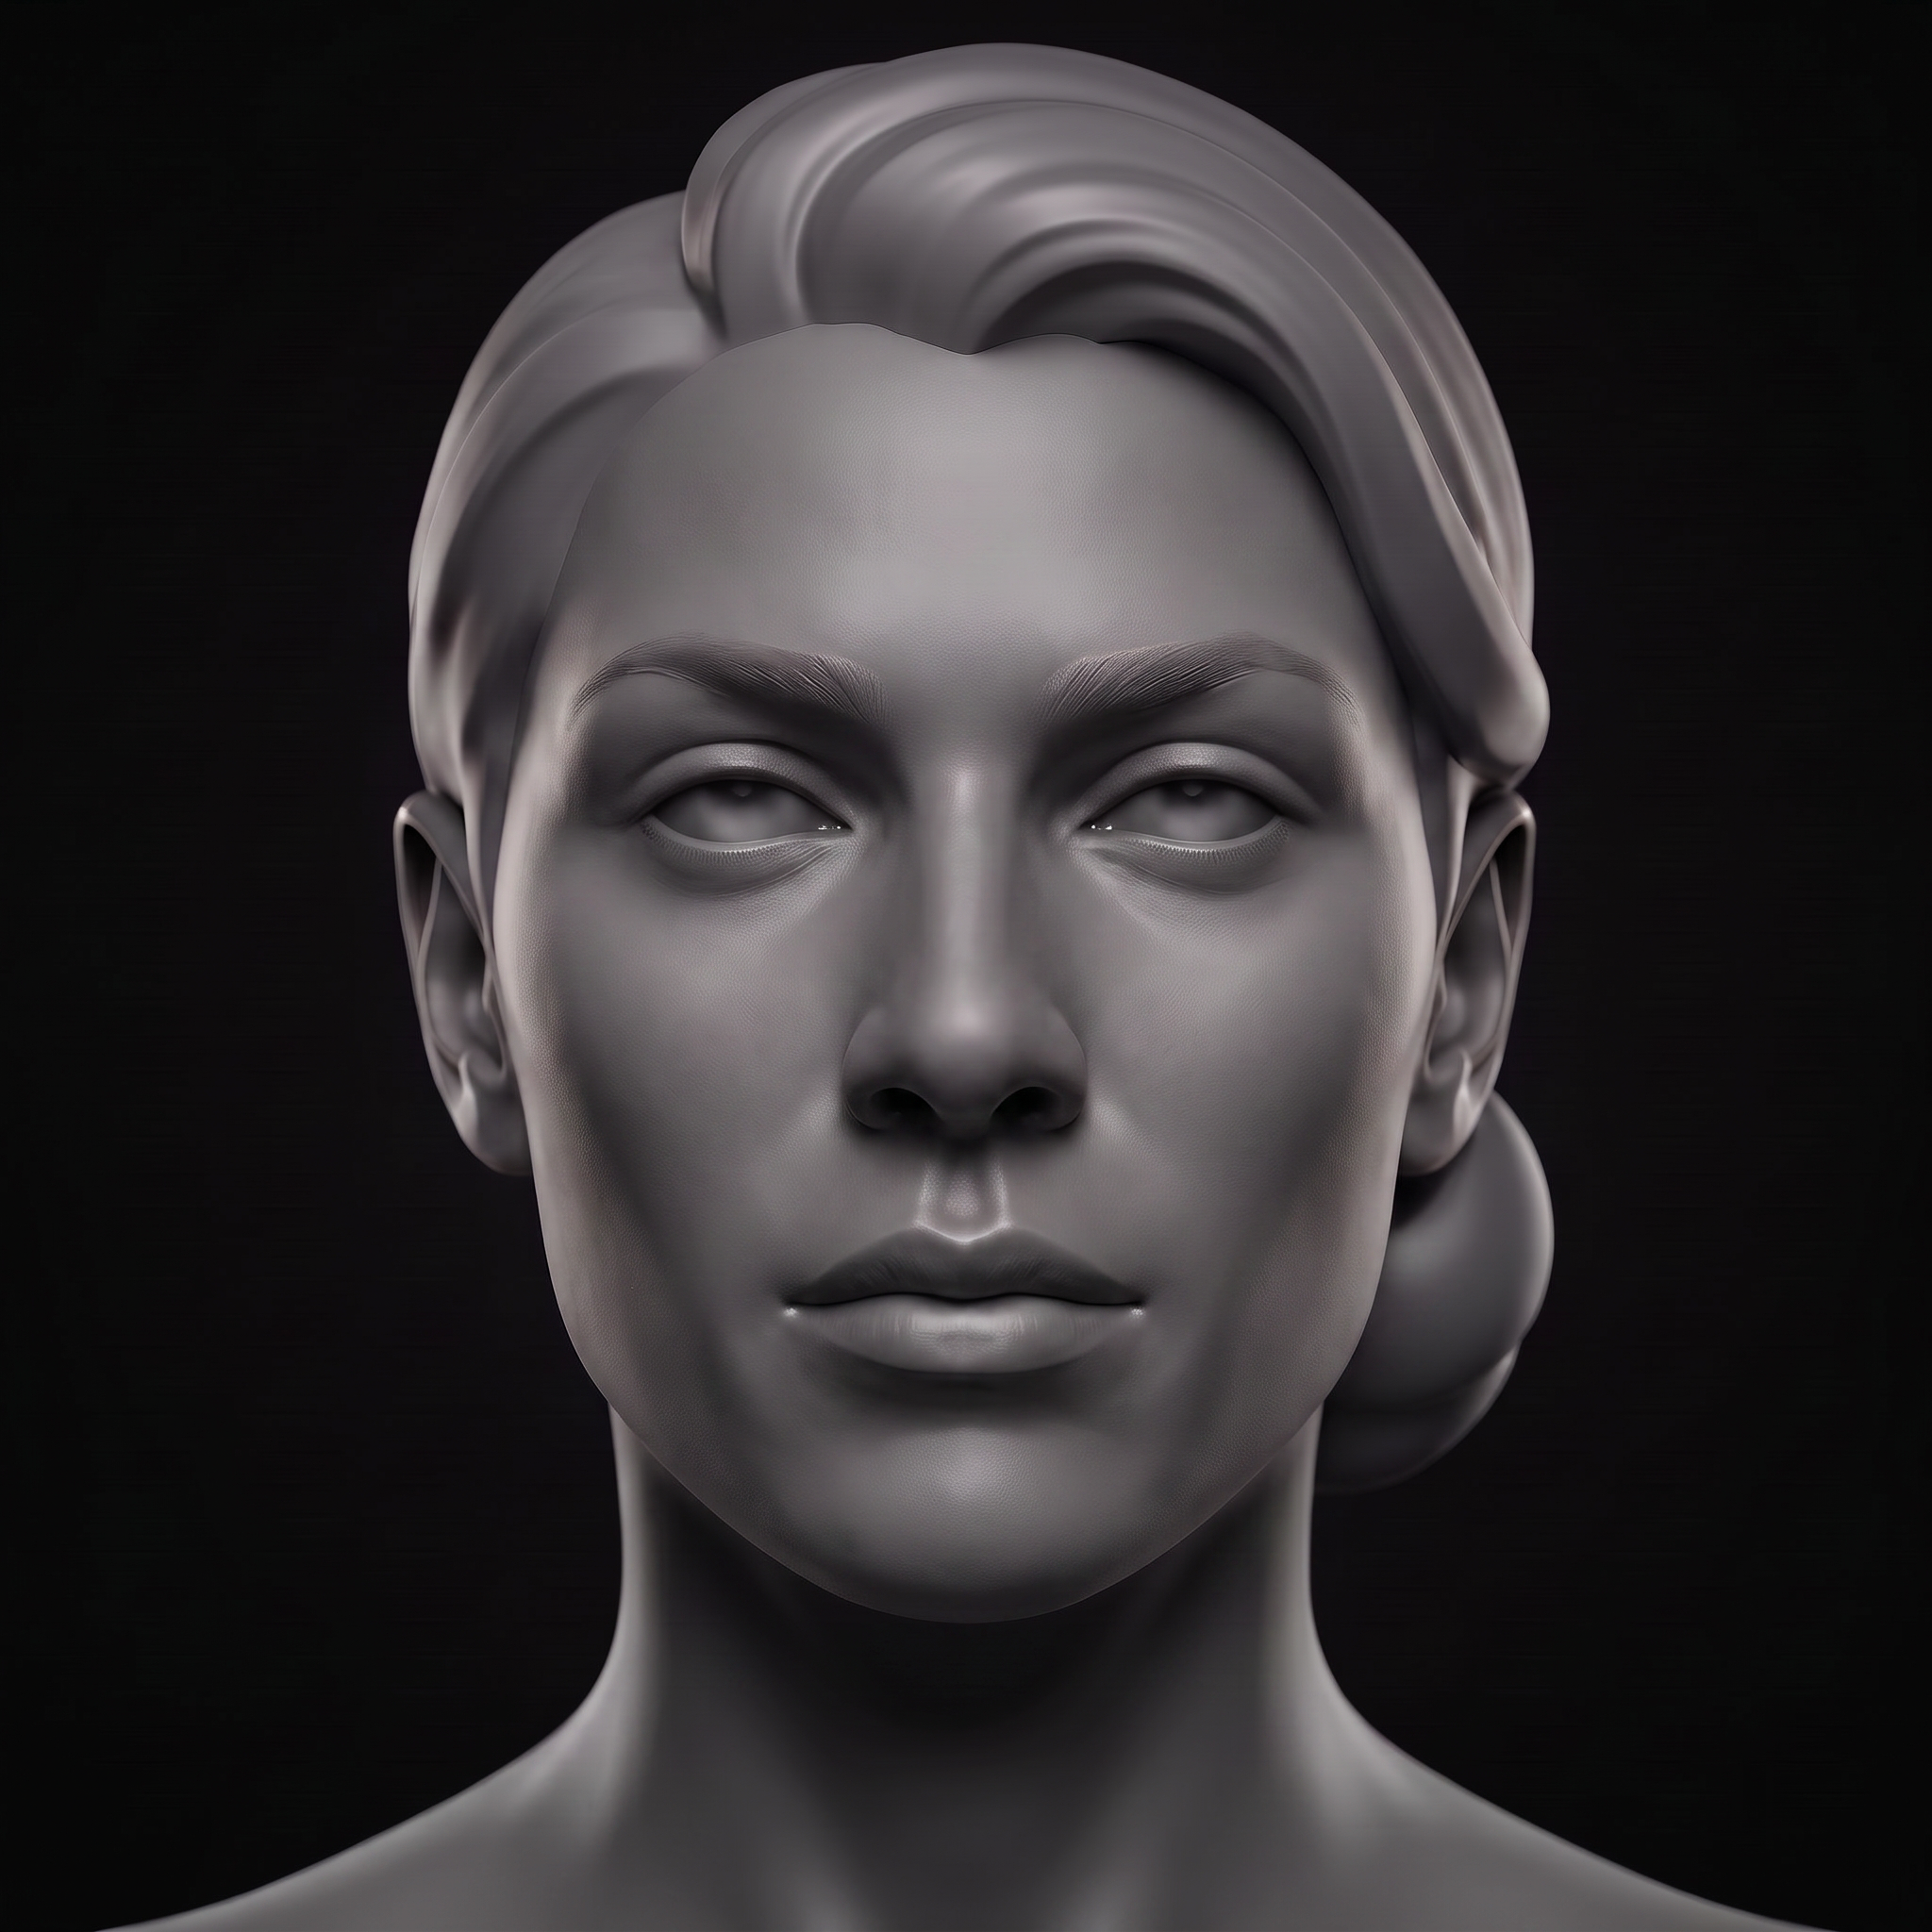
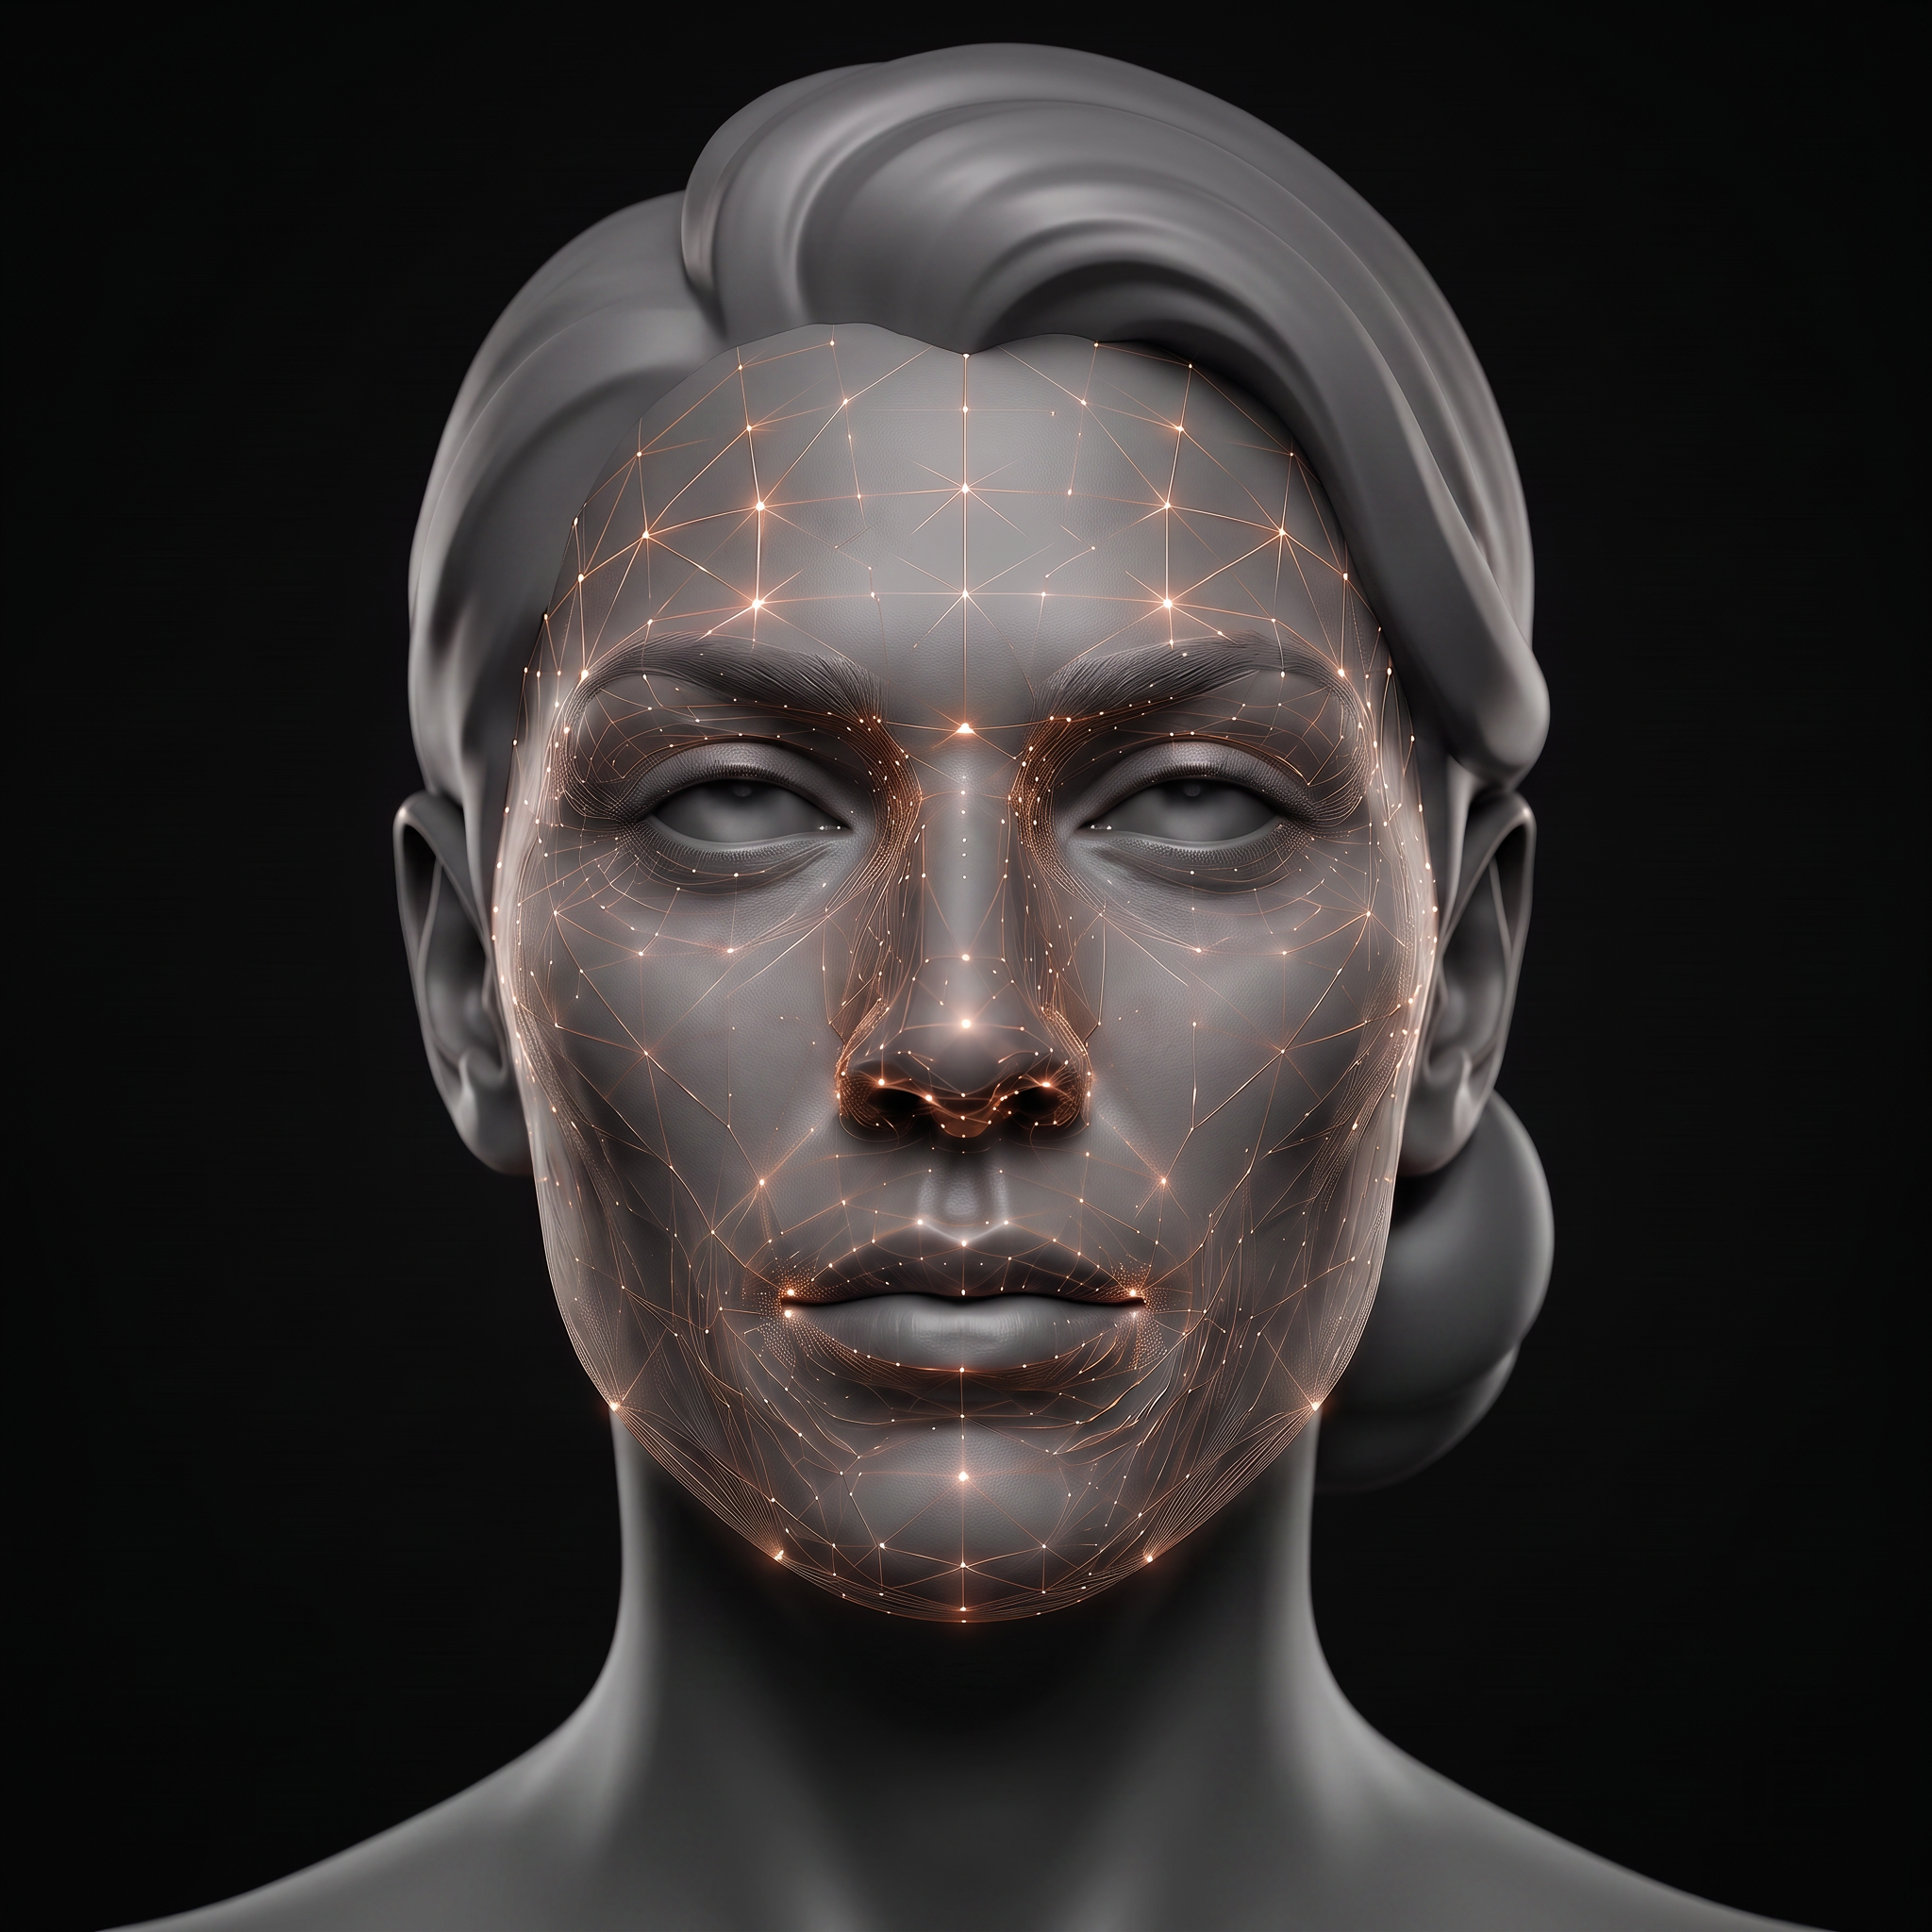
- Bizygomatic width
- 138.4 mm
- Upper face height
- 71.8 mm
- fWHR
- 1.93
- Range position
- Typical
How the scan works
Capture
Guided front-on frame with even light, no upload.
Landmark
478 point mesh placed on your face in real time.
Report
fWHR measured, normalised and explained.
What is fwhr?
A single ratio: bizygomatic width, the widest horizontal span across the cheekbones, divided by upper face height, the vertical distance from the upper eyelid line to the top of the upper lip.
How Facemap measures fwhr
Facemap identifies the outer edge of each cheekbone and the brow and upper lip reference points from the 478-point mesh, then divides the width by the height to produce a single number, unaffected by camera distance.
What the typical range looks like
Reported averages across studies typically sit between 1.6 and 2.1, with meaningful overlap between individuals. A higher fWHR is not inherently more or less typical, it simply describes a wider face relative to its upper height.
How to read your result
Read your fWHR alongside gonial angle and face shape, since a wide bizygomatic measurement without a corresponding jaw width will read differently structurally than one that carries through the lower face.
The fwhr formula: how we calculate it
Facial width-to-height ratio. Landmark numbers are MediaPipe Face Landmarker indices, and every distance is normalised to your own face so camera distance and image size cancel out.
dist(234, 454) / |y(13) - y(9)|
- Landmarks used
- 234, 454, 9, 13
- Reference target
- 1.90
- Tolerance band
- 0.42
Your reading is compared with that published reference on a Gaussian match curve: score = round( 100 x exp( -0.5 x ( (reading - target) / tolerance )^2 ) ), clamped to 1 to 99. Basis for the reference value: fwhr as defined in the behavioural science literature, bizygomatic width over upper-face height. The headline Attractiveness Score works differently: all readings are corrected for head angle and expression, weighted by confidence and mapped onto a 1 to 100 scale by a model calibrated against a published research set of more than Facemap scans.
Read the full Facemap methodology, including how the 22 measurement categories combine into your Attractiveness Score.
fWHR reference table
fWHR value bands and how each reads.
- Below 1.6Lower fWHR
Taller upper face relative to cheekbone width
- 1.6 to 1.8Typical
The range most commonly measured
- 1.8 to 2.0Higher fWHR
Wider face relative to upper face height
- Above 2.0High
Pronounced cheekbone width to height ratio
How fWHR is calculated, step by step
The measurement uses two straight-line distances taken from the same frontal scan.
- Bizygomatic width: outer left cheekbone point to outer right cheekbone point
- Upper face height: brow line to the top of the upper lip
- fWHR equals bizygomatic width divided by upper face height
What the research on fWHR actually shows
fWHR has been studied for correlations with traits such as dominance perception and competitiveness, but findings are inconsistent across replications and sample sizes are often small. Facemap reports the ratio as a structural measurement, not a behavioural or personality indicator.
Does fWHR change with weight or expression?
Soft tissue over the cheekbones can shift slightly with weight change, which moves bizygomatic width more than upper face height. Keeping a neutral, relaxed expression during the scan keeps the height measurement consistent across sessions.
The fWHR formula, step by step
The fWHR formula is a single division, and every input comes from the same frontal scan so the result is not affected by how far you sit from the camera.
- Measure bizygomatic width: outer left cheekbone point to outer right cheekbone point
- Measure upper face height: brow line to the top of the upper lip
- Divide bizygomatic width by upper face height
- The result is your fWHR, typically between 1.6 and 2.1
Your reading
Measure your fwhr in about twenty seconds.
The scan runs in your browser. Nothing is uploaded, and free basic reports need no account.
Questions
fWHR test: frequently asked questions
What is a good fWHR score?
There is no single good score. Reported values typically fall between 1.6 and 2.1, and the ratio simply describes proportion, not attractiveness or personality.
How is fWHR calculated?
Bizygomatic width, the distance across the cheekbones, divided by upper face height, the distance from brow line to upper lip.
Does fWHR predict dominance or personality?
Research findings are mixed and often do not replicate. Facemap presents fWHR as a structural measurement only, with no behavioural claim attached.
Can I measure fWHR from a photo?
A live scan is more reliable than a static photo because Facemap corrects for head angle before taking the two distances.
Is the fWHR calculator free to use?
Yes. It runs on-device with no account, and the scan is cleared from your browser when you leave the page.
What is the formula for fWHR?
Bizygomatic width divided by upper face height. Both distances come from the same frontal scan, so the formula produces one ratio, typically between 1.6 and 2.1.
How does the fWHR AI face scan work?
It uses Google's MediaPipe Face Mesh, a machine learning model that runs in your browser and places 478 3D landmarks on your face. Nothing is uploaded to a server. The ratio is then calculated from fixed geometry, not from an opinion or a subjective rating.
Related tools
Measurements that read alongside fwhr.
Jawline structure index
Gonial angle face scan
The angle at the back of the jaw, where the lower border meets the posterior border, a core index of lower-face definition.
Oval, round, square, heart
Face shape face scan
We compare jaw width, cheekbone width, forehead width and total face length to classify your face shape from six common categories.
Vertical proportion balance
Facial thirds face scan
The face is divided into three equal vertical zones: hairline to brow, brow to nose base, and nose base to chin. We measure how evenly your landmarks fall within each.
Every tool